Moving Beyond Progressive Failures: Democratize School Boards and Provide Suburban School Choice
Executive Summary
Diversity, Equity, and Inclusion (DEI) policies at the Kirkwood R-7 School District (KSD) are not reducing the racial achievement gap. The KSD DEI program additionally coincides with significant lower academic achievement for White students. Kirkwood is emblematic of a larger trend in public education where progressive failures are harming children.
Despite more favorable circumstances and a 58% increase in per-pupil spending since 2016, Kirkwood’s academic outcomes did not improve—showing that DEI policies failed to turn increased resources and improved conditions into better student performance.
Kirkwood’s DEI policies introduced Critical Pedagogy that produced unintended and counterproductive effects, including expanded ideological programming without improving academic outcomes. Rather than closing the racial achievement gap, these changes coincided with declining performance, declining enrollment, and rising administrative costs—raising serious questions about the effectiveness and accountability of the district’s DEI approach.
Purpose
The purpose of this post is to encourage the Missouri Legislature to pass K-12 Educational legislation to remedy the problems caused by progressive school boards and teachers’ unions. We advocate for the following:
Democratize school board elections by holding them on the same day as November national elections to increase participation and representation.
Expand school choice for suburban families by allowing education funding to follow students using Missouri’s state adequacy target.
The Origination of the DEI at Kirkwood
Kirkwood initiated a Task Force to Eliminate the Achievement Gap in 2015 and a report with 59-page report was submitted to the School Board on May 16, 2016. The program was started in 2017. The introduction of the report stated:
“Student scores on the Missouri Assessment Program (MAP) tests and End of Course (EOC) exams have increased significantly over the last ten years, in most schools and as a district. Standardized tests are but one measure used to gauge success – others will be mentioned later in the report – but our MAP and EOC scores are the primary methods by which we are held accountable to the state, to our community, and in the public eye. When analyzing these measures as a whole, our success is notable.”
The key point made at the very beginning of the document was that MAP and EOC scores are the primary measurement of success or failure. The document is available at this link. The above quote is found on page 4.
Understanding MAP and EOC Scores for Context
MAP and EOC scores are the result of an annual test that Missouri K-12 students take in the second semester of each school year. The results are tabulated and made publicly available in December of every year to the public. We requested the MAP and EOC data from 2010 to 2025, and it was provided to us by the Missouri Department of Elementary and Secondary Education (DESE). We then imported the data into a commercially available graph software to provide trend analysis.
There are four content areas that test results are broken down into, English Language Arts, Math, Science, and Social Studies. We determined to drop Social Studies since this content testing was relatively new and does not match understandable and internationally recognized tests of language, math, and science skills. The percentage at grade level proficiency represents the percentage of the cohort that has tested to be at the grade level of the test takers. DESE breaks down the results in quartiles in order of proficiency, Above Proficient, Proficient, Basic, and Below Basic.
We requested and received the results into the top two percentages and the bottom two percentages. This was done since the number of students that were Proficient and Above Proficient were those that successfully were at grade level proficiency. That is a single number to understand and recognize a trend. The second reason we requested a consolidation is that DESE will not report cohorts if the number of students falls below the value of a certain number of students. This is so that reviewers of data could not compare student rosters of a cohort to determine the identity of students in a particular failing cohort. By combining the top two and bottom two we could get results that met a cohort minimum.
What the Kirkwood Scores Show
The MAP & EOC scores show that between 2016, when the report’s recommendations were adapted and 2025, Kirkwood’s DEI programs had unintended reverse consequences. Then number of Black students who were at grade level proficiency dropped significantly for all three subject areas. The DEI policies coincide with a negative effect for White students.
English Language Arts
The ELA Racial Achievement Gap was not positively impacted by Kirkwood’s DEI policy and actually increased by 5 points from 2016 to 2025. More importantly, the percentage of Black and White Students academically proficient in ELA dropped.
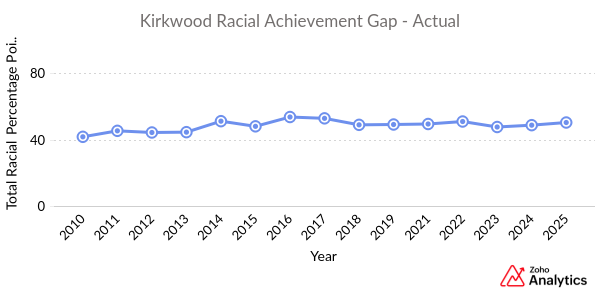
Kirkwood ELA Racial Achievement Gap – Actual 2010-2025
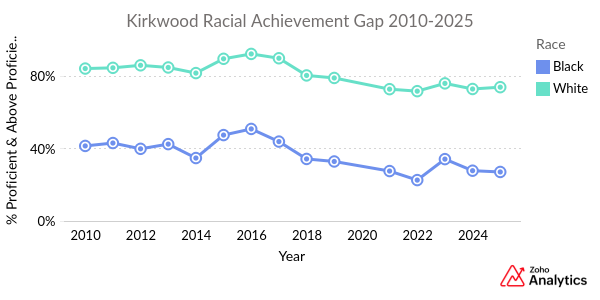
Percentage of Grade Level Proficient ELA MAP & EOC Scores for Kirkwood Black and White Students -2010-2025
Math
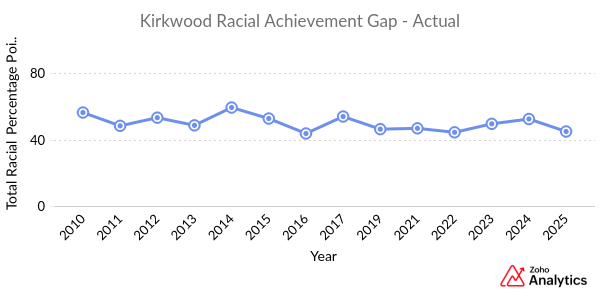
The percentage of academically proficient Black and White Students students dropped from 2016 to 2025. The test results suggest that Kirkwood’s DEI policy also had the negative outcome by increasing the math racial achievement gap by 8.6 points from 2016 to 2025.

Kirkwood Math Racial Achievement Gap – Actual 2010-2025

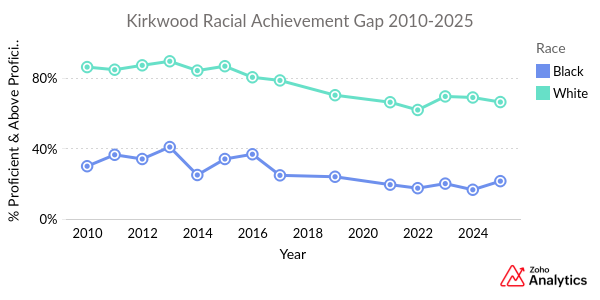
Percentage of Grade Level Proficient Math MAP & EOC Scores for Kirkwood Black and White Students -2010-2025
Science
The Science racial achievement gap slightly increased by 2.2 points. The percentage of academically proficient Both Black and White Science Students’ MAP & EOC scores dropped.
Kirkwood Science Racial Achievement Gap – Actual 2010-2025
Percentage of Grade Level Proficient Science MAP & EOC Scores for Kirkwood Black and White Students -2010-2025
Eliminating Alternative Causes
People defending DEI policies could point to other external variables. Table 4 provides student demographic data. This information was also obtained from DESE.
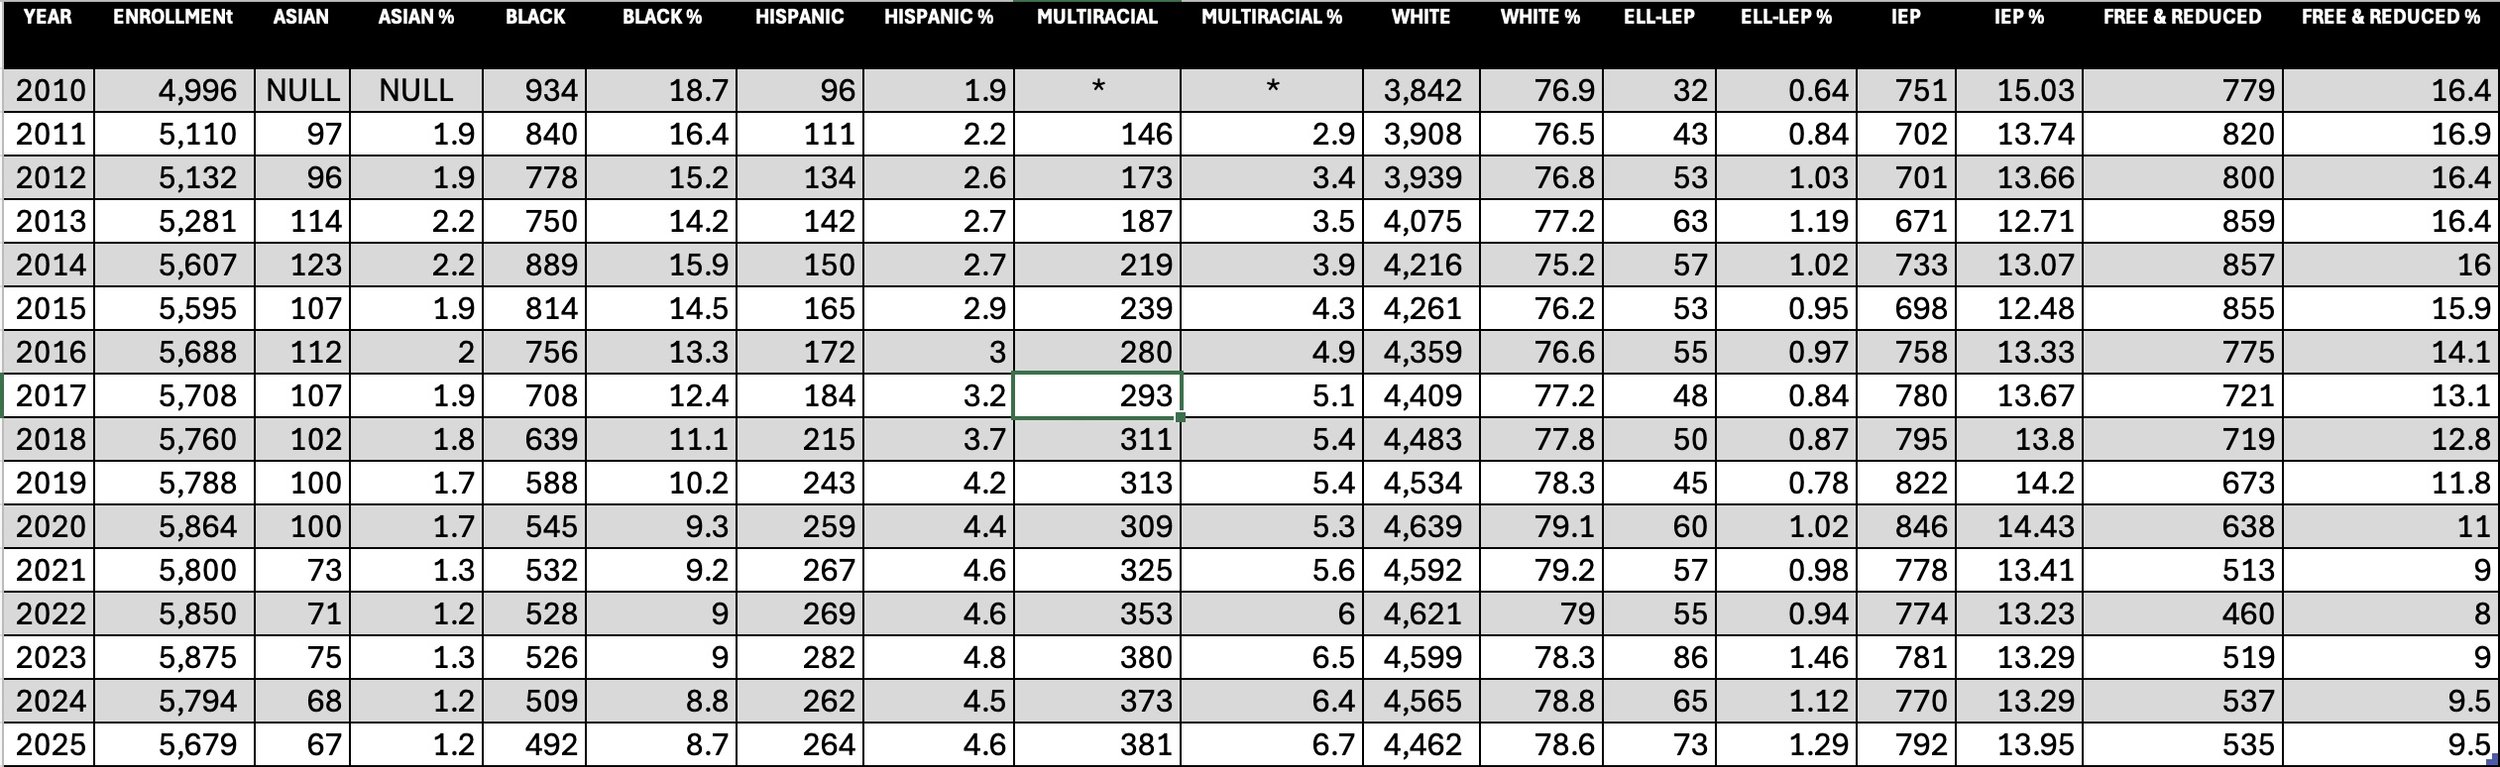
Kirkwood District Student Demographics from 2010-2025
The enrollment data shows that there were fewer Black students and the percentage of Black students declined from 2016 to 2025. This means that there was less of a strain on resources to assist the ever-smaller pool of Black students. The staff had fewer students to work with to improve their academic performance.
There were roughly the same number of “IEP” students. IEP stands for Individualized Educational Plan. The purpose of an IEP is to lay out the special education instruction, supports, and services a student needs to thrive in school. A dramatic increase in the number of IEP students would suggest that there was an influx of lower achieving students that needed remediation and more help.
There was a decline in the number of Free and Reduced Lunch students. Students that receive lunch at a free or reduced cost are typically lower income or poverty students and subsequently have lower academic achievement. Studies show that lower-income children are significantly less likely to succeed than their wealthier classmates. Therefore, since Kirkwood had fewer free and reduced students as a percentage the test scores should have been commensurately higher.
Per pupil spending data provided by DESE shows that the Kirkwood School District per student spending increased from 2016 to 2024 from $14,986.87 to $23,742.04. This is a is a 58.4% increase which far outpaces inflation. Therefore, the amount spending clearly did not decline. Studies show that improvements in the adequacy and equity of per-pupil spending are positively associated with improved student outcomes. Despite the huge increase in spending, DEI thwarted the effects of more per pupil funding.
Readers defending the district’s failures will point to the Covid-19 pandemic that caused schools to hold classes remotely. Kirkwood, due to the leadership of Former Assistant Superintendent Bryan Painter, did have an online learning platform firmly in place prior to 2020. Kirkwood was ahead of other districts in the implementation and use of Learning Management Systems. It is important to remember, however, that schools have been in session continuously and that students were back in the classrooms starting in August of 2021, for almost four full years. Another more relevant fact is that the test scores were already in decline starting in 2017 to 2019.
Unforeseen to Progressives but the Predictable Negative Effects of DEI
The most significant negative outcome of DEI was the adoption of Critical Pedagogy, which produced cultural negative effects. These included the expansion of racial justice frameworks, progressive political ideology, racial hiring quotas, and LGBTQ+ programming in Kirkwood schools under the banner of equity initiatives. Notably, the promotion of radical gender and sexuality ideology was never identified as a goal in 2016, making this shift a clear case of policies being sold under one purpose and implemented under another.
Religious parents are marginalized by pro-LGBTQ+ policies in public schools that leave little room for conscientious disagreement or parental involvement. Many of these policies are implemented without meaningful notice, opt-out options, or respect for families whose faith traditions hold different views on sexuality and gender. When parents raise concerns, they are often dismissed as intolerant rather than recognized as exercising their right to guide their children’s moral and religious upbringing. This dynamic creates a climate in which religious families feel pressured to remain silent or risk being labeled and sidelined, effectively limiting their ability to participate fully and freely in the public education system.
This trend—combined with declining academic performance and the spread of so-called “restorative justice” policies associated with DEI initiatives—has contributed to falling enrollment in Kirkwood’s public schools. At the same time, private schools in the region are experiencing growth. Several, including St. Paul’s Lutheran in Des Peres, are expanding their facilities to meet rising demand.
Although DEI was introduced in 2016 to address the racial achievement gap, it failed to improve academic performance and instead opened the door to a range of unforeseen problems. As a result, many families chose to leave the district and enroll their children elsewhere. This shift has contributed to a sustained decline in enrollment, with current enrollment that was overstated by approximately 600 students over a five-year period.
The DEI Directors, based upon the stated objective goals of the 2016 policy, had one job but have worsened the situation. The current title holder, according to the St. Louis Post-Dispatch, has a $144,000 a year position. He, additionally, has an hourly paid Secretary, according to KSD Board minutes, who will make over $50,000 if she works a 40-hour work week.
Conclusion
Kirkwood R-7 School District DESE MAP & EOC test scores in this report demonstrate that Kirkwood’s DEI initiatives have not achieved their central objective of closing the racial achievement gap and improving academic performance. Instead, MAP & EOC results from 2016 to 2025 show declining proficiency for both Black and White students across English Language Arts, Math, and Science—often alongside a widening achievement gap rather than a narrowing one.
These outcomes occurred despite conditions that typically support academic improvement: declining poverty indicators, stable special-education enrollment, fewer students requiring remediation, and a dramatic 58 percent increase in per-pupil spending that far outpaced inflation. In short, neither improved demographics nor substantially increased funding translated into better results.
At the same time, the adoption of Critical Pedagogy under the banner of DEI introduced ideological programming that produced unintended and counterproductive consequences, declining enrollment, unnecessary administrative costs, and concerns about parents’ rights. Some families responded by leaving the district.
Taken together, the evidence points to a clear conclusion: Kirkwood’s current DEI framework has failed to deliver measurable academic gains and has instead contributed to declining performance and enrollment losses.
Policy Recommendations
Voters in the Kirkwood School District are predominantly progressive Democrats. In 2024, President Trump received just 38 percent of the district’s vote. The local school board skews even further to the left, largely due to chronically low turnout in school board elections and the dominance of teachers’ unions. As a result, progressive ideology has become deeply entrenched in district governance. For more than four decades, openly moderate and conservative candidates have repeatedly been defeated in school board races, reinforcing a political dynamic that has proven difficult to overcome.
Progressive leadership has shown little willingness to acknowledge policy failures or change course, even in the face of declining academic outcomes. Given the growing harm to students’ educational welfare, we recommend the following legislative actions:
Democratize school board elections by holding them on the same day as November national elections to increase participation and representation.
Expand school choice for suburban families by allowing education funding to follow students using Missouri’s state adequacy target.
Access the Data
You can access the data using the interactive graph software. Enter the Content Area in the <Select> drop down box.
Other St. Louis Area School Districts
Here is the Racial Achievement Gap data from other St. Louis area districts. Keep in mind that DESE will not provide all the data for all the years for a variety of reasons. The biggest reason is that if there were too few students in a cohort they will not publish the data. The reason given is that if there were too few students the reader who might have knowledge of the students could determine who the students were. This was an attempt to shield students from public embarrassment for low test results. MAP and EOC data was many times simply not provided with no reason given. Another factor was that there were no tests taken in 2020 due to Covid. For this graph enter in the District and Content Area.